Turning measurements into spectrum usage & coverage maps
SpectrumMap is a cloud-based big data system that collects real-world spectrum usage data from various fixed, mobile, and portable monitoring devices. It integrates seamlessly with LS OBSERVER and third-party systems, ensuring comprehensive data collection.
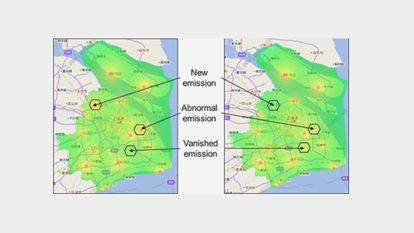
By leveraging smart interpolation, SpectrumMap generates an interactive, area-wide spectrum usage map, providing accurate signal level estimations without the need for complex queries or manual sensor identification.
This web-based solution supports spectrum analysis, verification of simulation results, detection of unlicensed emissions, and optimization of spectrum usage. Additionally, it serves as a valuable tool for regulatory decision-making and policy development.
Experience a new standard in spectrum visualization and maximize the value of your monitoring data.
Why use SpectrumMap?
Learn more about the key benefits of SpectrumMap

Perform Spectrum Audits
- Solve the problem of low spectrum utilization
- Optimize frequency planning and allocation
- Improve the allocation mechanism and ensure more fair and reasonable use of spectrum resources
- Lay the foundation for future marketization of spectrum resources
- Pave the way to dynamic spectrum allocation, thereby improve the efficiency of spectrum usage

Support the Frequency Assignment Process
- Visualize frequency availability to improve the frequency assignment process
- Automatic data analysis instead of traditional manual work, thereby improve work efficiency
- Process frequency assignment based on "real world" monitoring data, therefore improve the accuracy
- Sophisticated algorithm and accurate calculation guarantee more efficient usage of spectrum resources

Supervise Radio Stations
- Employ new technologies (big data & cloud computing) to supervise radio stations.
- Detect illegal stations timely
- Clean up expired and idle stations to get more available sites and frequencies
- Improve the accuracy and effectiveness of license database
- Timely recycle frequencies to meet the increasing demand on spectrum resources

Detect Interference
- Actively detect interference and deal with it timely
- Reduce labor intensity and improve the efficiency of interference investigation
- Change from manual to digital and automatic operations, making full use of all available data

Assess Radiation Hazard
- Improve public awareness of electromagnetic radiation
- Publish authoritative information of electromagnetic environment, thereby ease public tension on radio stations
- Regularly release electromagnetic radiation index as a public environmental information service